Transparency is the foundation that trust is built upon.
Build trust and accountability through a modern approach to transparency.
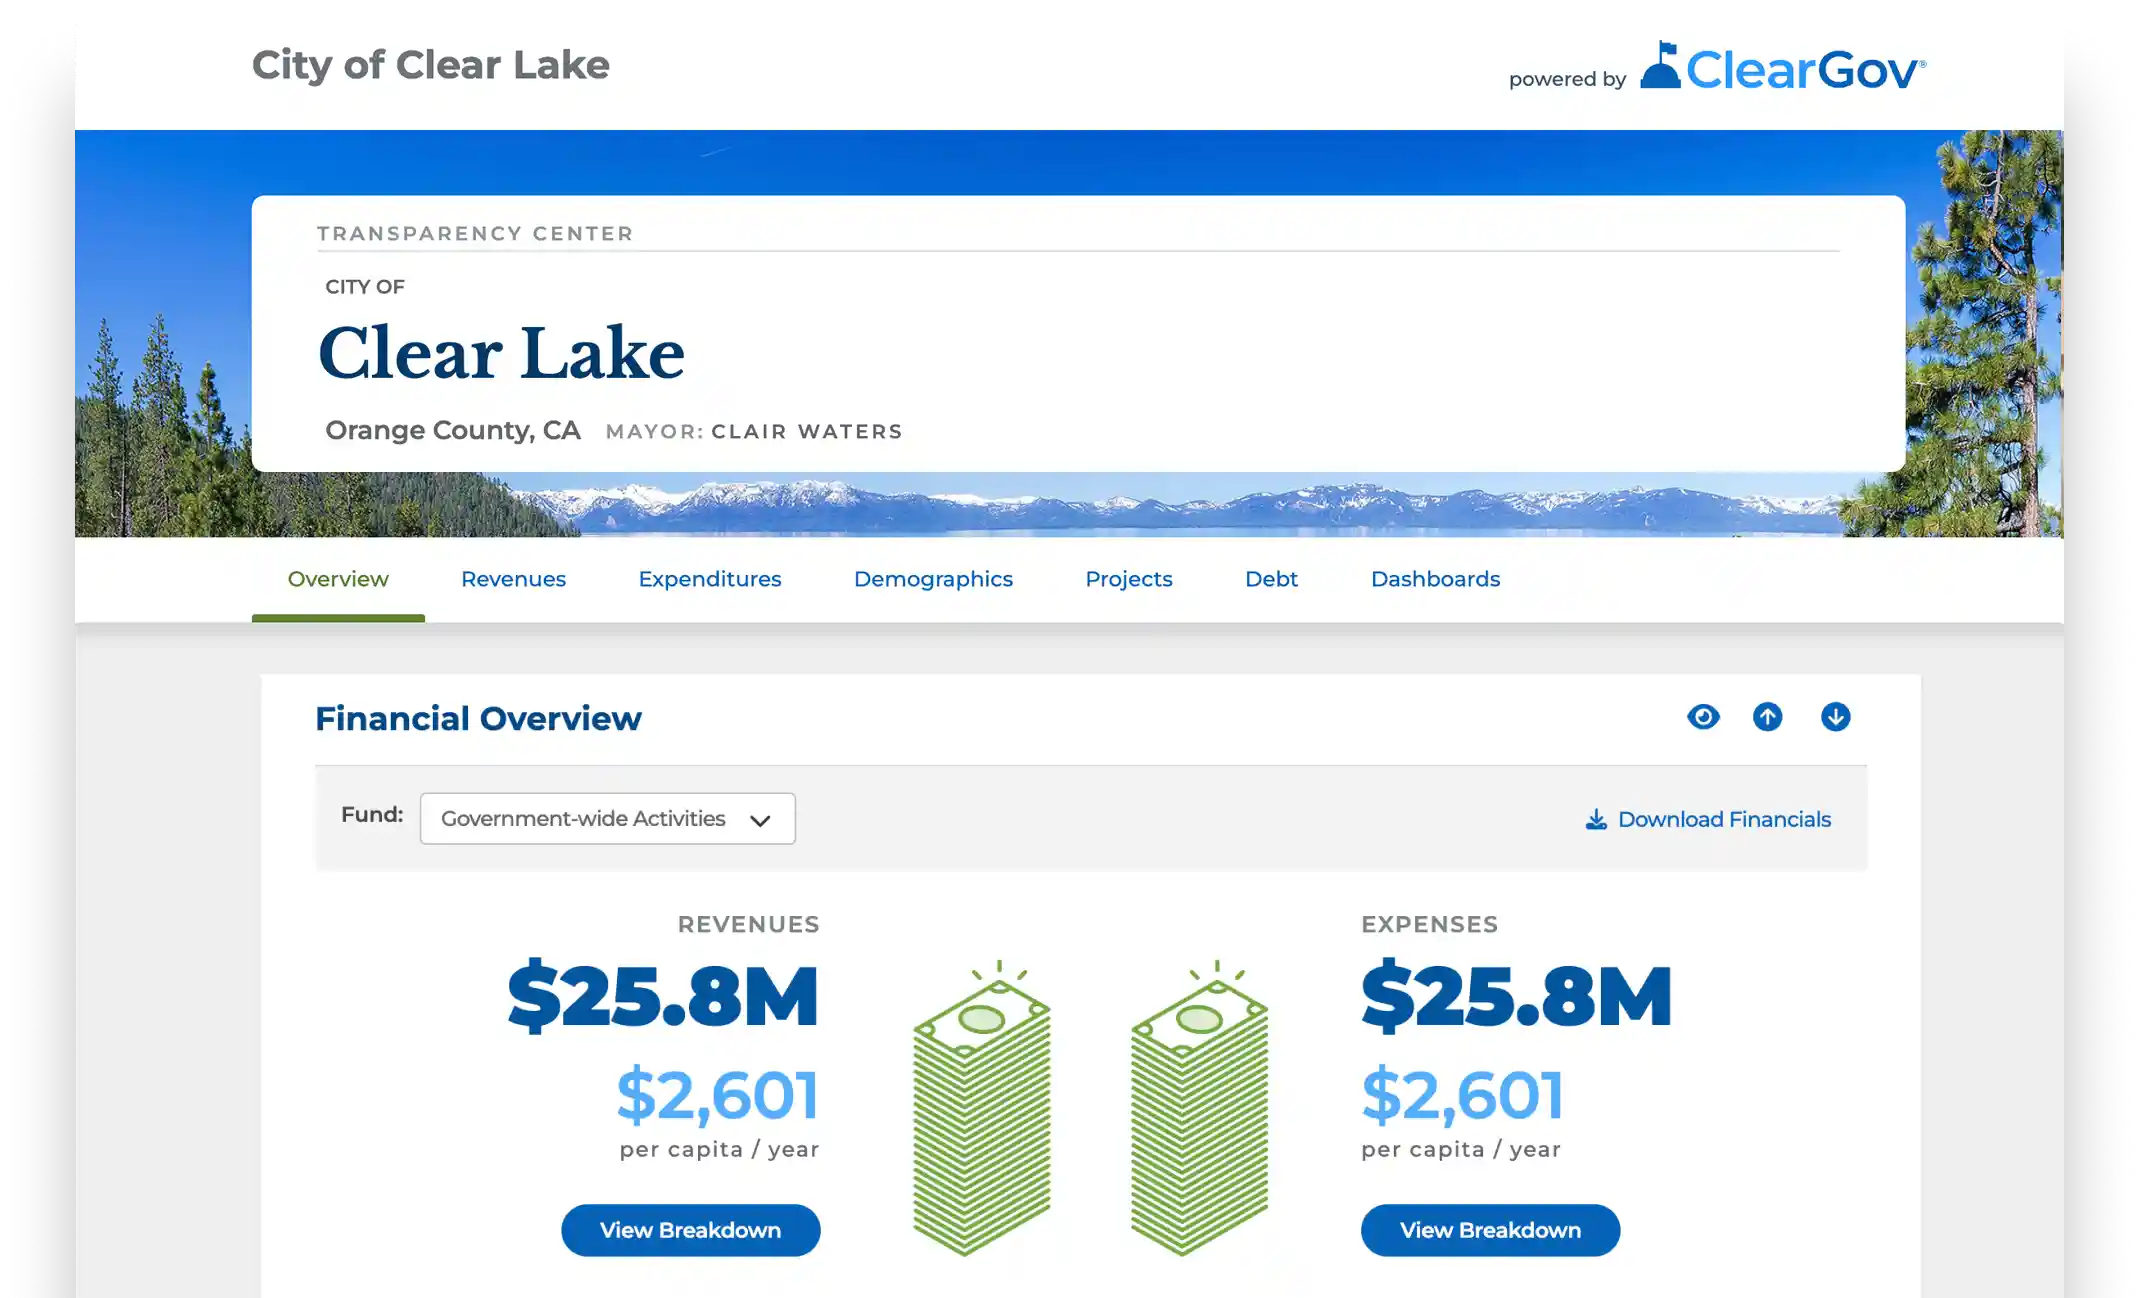
Auto-generated Content
Auto-generated Content
ClearGov generates infographics, charts, and graphs automatically for your Transparency center, based on your budget data and other public sources.
- Populate pages with compelling visuals effortlessly.
- Display complex data in a way that’s easy to understand.
- Customize content and update data easily.

Financial Story
Financial Story
Tell the story behind the numbers in a way that is easy for everyone to visualize, without the endless spreadsheets. Engaging infographics simplifies complex data, and you can add a narrative to provide context.
- Share revenues and expenses over time.
- Show fund breakdowns by department or object.
- Engage viewers with interactive graphs and charts.

Demographics
Demographics
The evolving characteristics of your population are not only important in lending context to your budget but also for attracting businesses and future residents. We make this data a breeze to share, and easy to understand.
- Access dynamic infographics instantly from public data.
- Share metrics on population, growth, home value, and more.
- Edit figures easily or add a narrative to customize content.

Department Dashboards
Department Dashboards
Invite department heads to create their own dashboards to share their story, highlight performance metrics, and more using flexible template-based pages.
- Customize dashboards with content, charts, images, and more.
- Centralize all department dashboards in one location.
- Share updates to social media that don’t get lost in a newsfeed.

Projects
Projects
From new buildings to roadwork and beyond, quickly create and present detailed project pages to share the work going on in your community with the public.
- Highlight project details, budget, timelines, and more.
- Update projects anytime to show progress and status updates.
- Enable residents to subscribe to project updates via email.

Chart Builder
Chart Builder
Your Transparency center is automatically populated with dynamic charts using your data — and you’ll have full access to ClearGov’s robust chart builder to create more.
- Choose from many chart types and sizes to enhance your page.
- Access a centralized chart library to make edits anytime.
- Export charts as an image to use anywhere.

Citizen Engagement
Citizen Engagement
Provide constituents with a place to comment on your ongoing activities and spending, in a platform that allows you to control the narrative and what the public can see.
- View comments first, then choose to make them public.
- Answer questions publicly or privately to start a dialog.
- Provide context on certain topics easily.

Our customers are usually speechless, however…
We were impressed with the ClearGov solution from the start, especially the clean, simple interface. They are experts at presenting complex information in an easy-to-understand and visually-appealing way. And, as our partners, they have been responsive and professional.
Christopher BradburyVillage AdministratorRye Brook, NY
How Transparency works.

Import
Budget
Simply export fiscal data from your accounting system and ClearGov will do the rest. Or, if you’re using ClearGov Operational Budgeting, the tool can seamlessly pull in the data for you.

Customize
Templates
Transparency is a turnkey solution, with endless built-in features to customize pages and add content to enhance your profile.

Present &
Share
Your Transparency center compliments your organization’s website and can easily be shared there with an attractive banner to engage citizens.

Update
Progress
Transparency is an ongoing effort, ClearGov makes it easy to update financials, projects, and other information as you evolve, as frequently as you’d like.
Resource Center
View All Resources-

Fair Oaks Ranch, Texas
-

ClearGov Helps Counties Move FowardTogether During National County Government Month
-

ClearGov Named Business Solutions Partner By Florida Association Of Counties (FAC)
-

Smart Budgeting: How Schools Can Thrive After COVID Relief Funds Evaporate
-

5 Keys To Enhance Civic Engagement
-

Webinar Recording: 5 Keys to Enhance Civic Engagement
-

How To Choose The Right Budgeting Tool For Your School District
-

Webinar: Small Team, Big Results: Enhancing Efficiency with ClearGov’s Time-Saving Tools
-

ClearGov Secures Position As Leading Planning & Budgeting Solutions Provider For Local Governments & Schools
-

An Interview With The ClearGov Data Onboarding Team – Part 3
-

An Interview With The ClearGov Data Onboarding Team – Part 2
-

An Interview With The ClearGov DOC Team – Part 1